DTU Configuration Tool Overview
The software interface consists of the following blocks:
- Control Panel - buttons to manage data logger settings
- Information about Connected Device - displays information about the connected device
- Main window with operating tabs: System, GPIO, Interfaces (available for DTU2xx only), Schedule, SMS, Energy Saving.
- Debug console - console window with log messages about current processes and changes in device operation.
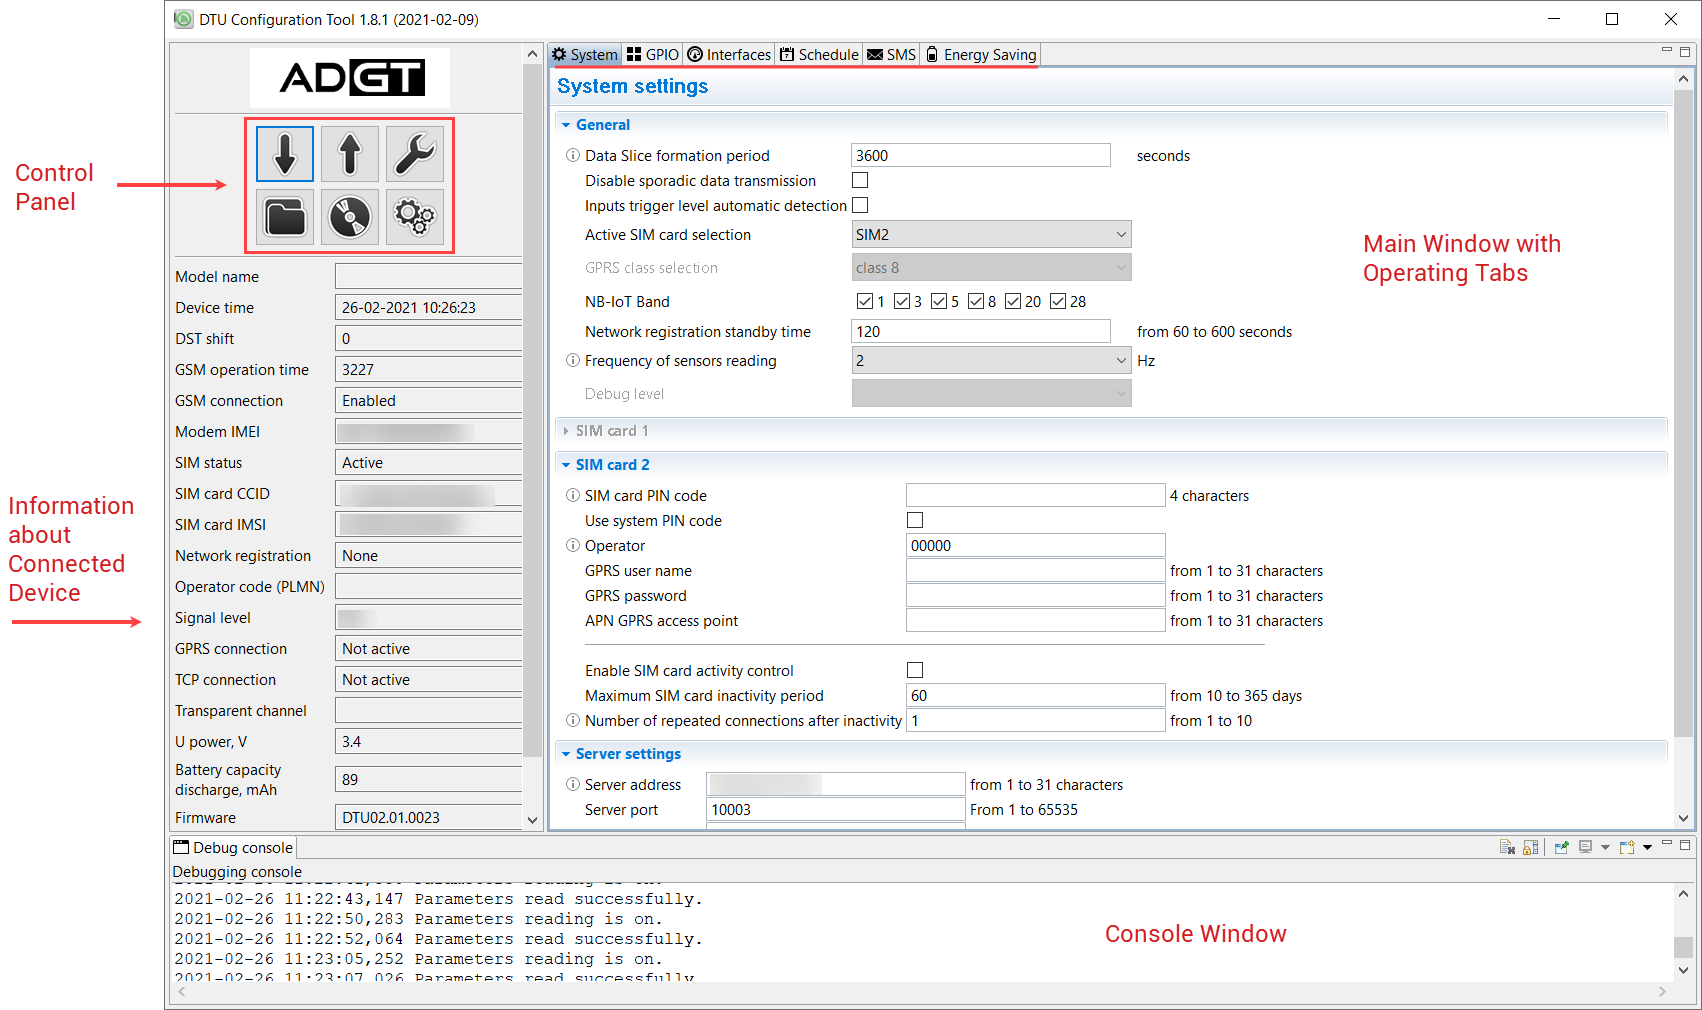
Control Panel
Control panel contains six buttons to control data logger settings.
| Button | Function | |
|---|---|---|
|
|
Read current settings | Button to read the current parameters obtained from the connected DTU. |

|
Save settings | Button to save any changes made. The button should be pressed after each change of the parameters. |

|
Service functions | Button opens the window, where it is possible to update the firmware version, reboot the device, reset the DTU configuration to factory settings, as well as set the time values from the computer to device. |
|
|
Open settings file | Button to download the previously saved settings from PC (in the .xml format). |
|
|
Save settings file | Button to save modifications in DTU configuration on PC (in the .xml format). |
|
|
Program settings | Button to configure data logger connection parameters. |


Information on connected device
In order to read the information on the connected data logger in the table, click the Read Current Settings button on the control panel. In case any parameters are not displayed, wait for a while and click the button once again.
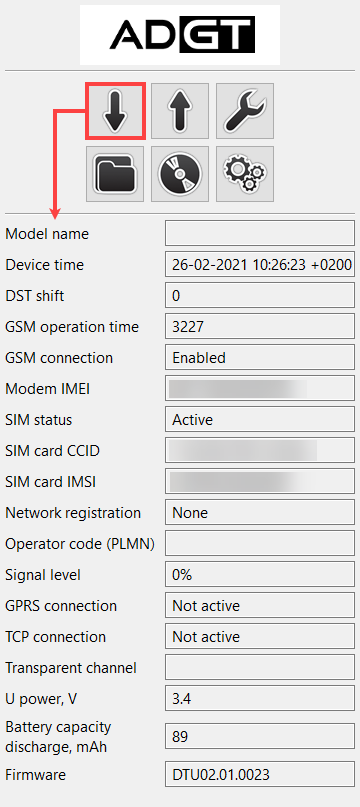
The following information is displayed in the table:
-
Model name - DTU data logger model name (parameter for DTU2xx only)
-
Device time — current date and time established in data logger at the first connection to the server. When you first configure, and if the synchronization with the server was not performed, the device could display the date and time parameters that differ from the current ones.
-
DST shift — parameter displays daylight saving time shift (if enabled). If the DST option is enabled (on the Schedule tab), data logger reads the shift value depending on the set DST mode. If the DST option is disabled, no information is displayed in the line.
-
GSM operation time, sec — time period of the device power supply operation starting from the device switch-on and to the current moment. The parameter is non-resettable.
-
GSM connection — GSM module status (Enabled/Disabled).
-
Modem IMEI — Data Logger GSM module identification number.
-
SIM card parameters: SIM status (active/not active), serial number (CCID), international mobile subscriber identity (IMSI), DTU cellular network registration.
-
Operator code (PLMN) — see Operation in the NB-IoT Network.
-
Signal level, % — signal emission power level in the GSM network.
-
GPRS connection — parameter becomes active, when the GPRS connection is established.
-
TCP connection — parameter becomes active, when the TCP connection is established (the indicator starts flashing red).
-
Transparent channel — parameter becomes active only when the transparent channel on the Interfaces tab is enabled in the Separate mode. Possible states: Not active, Authorization, Active. Parameter for DTU2xx only.
-
U power supply, V – accumulator battery voltage (in Volts).
-
Battery capacity discharge, mAh — the current amount of consumed battery power (in mAh)
-
Firmware — the current version of firmware installed in the data logger.